Click above for complete view.
Scores Rise, but Achievement Gap Persists
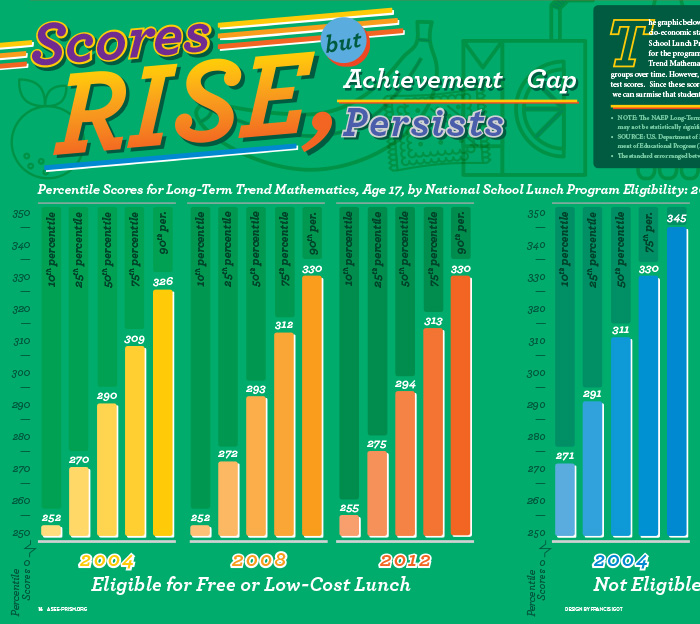
The graphic above compares the math performance of 17-year-old high school students according to socio-economic status, commonly shown by a student’s eligibility for the free and reduced-price National School Lunch Program. Parent earnings must fall below a certain threshold for a student to be eligible for the program. Data from the National Assessment of Educational Progress (NAEP) Long-Term Trend Mathematics Assessment show that student scores have improved by equal amounts for both groups over time. However, more affluent students—those ineligible for reduced-price lunch—have higher math test scores. Since these scores are an important selection criterion for admission to most engineering programs, we can surmise that students from higher-income households stand a better chance, in general, of getting in.
• NOTE: The NAEP Long-Term Trend Mathematics scale ranges from 0 to 500. Some apparent differences between estimates may not be statistically significant.
• SOURCE: U.S. Department of Education, Institute of Education Sciences, National Center for Education Statistics, National Assessment of Educational Progress (NAEP), 2004, 2008, and 2012 Long-Term Trend Mathematics Assessments.
• The standard error ranged between 0.6 and 3.1
Compiled by Brian Yoder
Infographic by Francis Igot